Star-Formation Rate
This page is also an executable Jupyter notebook: open / download sfr.ipynb. The notebooks run end-to-end and double as part of Mera's test suite.
Mera measures star formation directly from the star particles, in two complementary ways:
sfr, the star-formation history SFR(t): stellar mass formed per time bin, in M☉/yr.sfr_snapshot, the current SFR from a single snapshot: mass formed within recent look-back windows (the observational "current SFR", e.g. Hα ≈ 5 to 10 Myr, FUV ≈ 100 Myr), plus the lifetime-averaged rate.
Star particles are selected by the universal sentinel birth ≠ 0; the formation-time axis is always physical (non-cosmological runs use the proper birth time, cosmological runs convert via the Friedmann table). This notebook runs on the non-cosmological mw_L10 disk galaxy (output 300), which carries star particles.
Companion to the Star-Formation Rate doc page.
# Example-data root. Point this at your own simulation folder, or set the
# MERA_EXAMPLES environment variable; every path below is built from it.
MERA_EXAMPLES = get(ENV, "MERA_EXAMPLES", "/Volumes/FASTStorage/Simulations/Mera-Tests");

using Mera
info  = getinfo(300, joinpath(MERA_EXAMPLES, "RAMSES/mw_L10"))
parts = getparticles(info)
gas   = gethydro(info)
println("particles loaded : ", length(parts.data))
println("hydro cells      : ", length(gas.data))
*__ __ _______ ______ _______
| |_| | | _ | | _ |
| | ___| | || | |_| |
| | |___| |_||_| |
| | ___| __ | |
| ||_|| | |___| | | | _ |
|_| |_|_______|___| |_|__| |__|
Mera v1.8.0 | Julia 1.12.7 | 8 threads
[Mera]: 2026-09-09T19:08:00.202
Code: RAMSES
output [300] summary:
mtime: 2023-04-09T05:34:09
ctime: 2025-06-21T18:31:24.020
=======================================================
simulation time: 445.89 [Myr]
boxlen: 48.0 [kpc]
ncpu: 640
ndim: 3
cosmological: false
-------------------------------------------------------
amr: true
level(s): 6 - 10 --> cellsize(s): 750.0 [pc] - 46.88 [pc]
-------------------------------------------------------
hydro: true
hydro-variables: 7 --> (:rho, :vx, :vy, :vz, :p, :scalar_00, :scalar_01)
hydro-descriptor: (:density, :velocity_x, :velocity_y, :velocity_z, :pressure, :scalar_00, :scalar_01)
γ: 1.6667
-------------------------------------------------------
gravity: true
gravity-variables: (:epot, :ax, :ay, :az)
-------------------------------------------------------
particles: true
- Nstars: 5.445150e+05
particle-variables: 7 --> (:vx, :vy, :vz, :mass, :family, :tag, :birth)
particle-descriptor: (:position_x, :position_y, :position_z, :velocity_x, :velocity_y, :velocity_z, :mass, :identity, :levelp, :family, :tag, :birth_time)
-------------------------------------------------------
rt: false
clumps: false
-------------------------------------------------------
namelist-file: ("&COOLING_PARAMS", "&SF_PARAMS", "&AMR_PARAMS", "&BOUNDARY_PARAMS", "&OUTPUT_PARAMS", "&POISSON_PARAMS", "&RUN_PARAMS", "&FEEDBACK_PARAMS", "&HYDRO_PARAMS", "&INIT_PARAMS", "&REFINE_PARAMS")
-------------------------------------------------------
boundaries: not periodic (&BOUNDARY_PARAMS closes x, y, z)
timer-file: true
compilation-file: false
makefile: true
patchfile: true
=======================================================
[Mera]: Get particle data: 2026-09-09T19:08:04.228
Using threaded processing with 8 threads
Key vars=(:level, :x, :y, :z, :id, :family, :tag)
Using var(s)=(1, 2, 3, 4, 7) = (:vx, :vy, :vz, :mass, :birth)
domain:
xmin::xmax: 0.0 :: 1.0 ==> 0.0 [kpc] :: 48.0 [kpc]
ymin::ymax: 0.0 :: 1.0 ==> 0.0 [kpc] :: 48.0 [kpc]
zmin::zmax: 0.0 :: 1.0 ==> 0.0 [kpc] :: 48.0 [kpc]
Processing 640 CPU files using 8 threads
Mode: Threaded processing
Combining results from 8 thread(s)...
Found 5.445150e+05 particles
Memory used for data table :38.428720474243164 MB
-------------------------------------------------------
[Mera]: Get hydro data: 2026-09-09T19:08:07.695
Key vars=(:level, :cx, :cy, :cz)
Using var(s)=(1, 2, 3, 4, 5, 6, 7) = (:rho, :vx, :vy, :vz, :p, :scalar_00, :scalar_01)
domain:
xmin::xmax: 0.0 :: 1.0 ==> 0.0 [kpc] :: 48.0 [kpc]
ymin::ymax: 0.0 :: 1.0 ==> 0.0 [kpc] :: 48.0 [kpc]
zmin::zmax: 0.0 :: 1.0 ==> 0.0 [kpc] :: 48.0 [kpc]
📊 Processing Configuration:
Total CPU files available: 640
Files to be processed: 640
Compute threads: 8
GC threads: 8
Processing files: 100%|██████████████████████████████████████████████████| Time: 0:00:18 (29.43 ms/it)
✓ File processing complete! Combining results...
✓ Data combination complete!
Final data size: 28320979 cells, 7 variables
Creating Table from 28320979 cells with max 8 threads...
Threading: 8 threads for 11 columns
Max threads requested: 8
Available threads: 8
Using parallel processing with 8 threads
Creating IndexedTable with 11 columns...
✓ Table created in 39.77 seconds
Memory used for data table :2.321086215786636 GB
-------------------------------------------------------
particles loaded : 544515
hydro cells : 28320979Star-formation history
sfr(parts; tbinsize=...) returns left bin edges t [Myr] and the SFR s [M☉/yr]. The integral of the history recovers the total stellar mass formed: sum(s) * tbinsize * 1e6 ≈ Σ stellar mass.
By default mass=:auto prefers a stored initial-mass column (SFR should use the birth mass, not the current mass reduced by post-formation mass loss). When a run stores only the current mass, as mw_L10 does, Mera rebuilds the birth mass from the supernova fraction the run itself recorded, and prints one line saying so. The next section covers that.
t, s = sfr(parts; tbinsize=20.0)     # t = left bin edges [Myr], s = SFR [M☉/yr]

println("number of time bins  : ", length(t))
println("time range     [Myr] : ", (first(t), last(t)))
println("peak SFR     [M☉/yr] : ", maximum(s))
println("mean SFR     [M☉/yr] : ", sum(s)/length(s))
@show sum(s) * 20.0 * 1e6            # ≈ total stellar mass formed [M☉]
[ Info: sfr: using eta_sn=0.2 from the run's namelist to rebuild birth masses from the current :mass. Stars older than 5.0 Myr are scaled by 1/(1-eta_sn), which RAISES the rate. Pass eta_sn=0 to switch this off, or eta_sn=<value> to set it.
number of time bins : 23
time range [Myr] : (1.419158337486011, 441.419158337486)
peak SFR [M☉/yr] : 1.485425
mean SFR [M☉/yr] : 1.1877467391304348
sum(s) * 20.0 * 1.0e6 = 5.463635e85.463635e8SN mass-loss correction
A star older than t_sn_delay Myr (default 5) has already returned a fraction eta_sn of its mass to the gas, so the mass stored today is smaller than the mass that formed. Rescaling by 1/(1-eta_sn) recovers the birth mass.
RAMSES writes that fraction into its namelist and getinfo reads it into info.part_info.eta_sn, so the default eta_sn=:auto uses the run's own value. Give a number to override it, or eta_sn=0 to integrate the current mass exactly as stored. It is ignored, with a warning, when an initial-mass column is in use, since that is already the birth mass.
println("this run recorded eta_sn = ", info.part_info.eta_sn)

t0, s0 = sfr(parts; tbinsize=20.0, eta_sn=0)     # off: the current mass, as stored
t2, s2 = sfr(parts; tbinsize=20.0)               # default: the run's own eta_sn

println("peak SFR, correction off [M☉/yr] : ", maximum(s0))
println("peak SFR, run's eta_sn   [M☉/yr] : ", maximum(s2))
this run recorded eta_sn = 0.2
peak SFR, correction off [M☉/yr] : 1.19558
peak SFR, run's eta_sn [M☉/yr] : 1.485425Current SFR from one snapshot
sfr_snapshot returns the current SFR over look-back windows (default [5, 10, 100] Myr) plus the lifetime-averaged rate. For each window Δt, SFR(Δt) = M⋆(age ≤ Δt) / Δt.
snap = sfr_snapshot(parts)        # default windows [5, 10, 100] Myr

println("windows         [Myr] : ", snap.windows)
println("SFR per window [M☉/yr]: ", snap.sfr)
println("lifetime mean  [M☉/yr]: ", snap.sfr_mean)
println("n_stars               : ", snap.n_stars)
println("stellar mass    [M☉]  : ", snap.stellar_mass_Msol)
println("mass field used       : ", snap.mass_field)
windows [Myr] : [5.0, 10.0, 100.0]
SFR per window [M☉/yr]: [1.3736, 1.54955, 1.417555]
lifetime mean [M☉/yr]: 1.2292556033118338
n_stars : 544515
stellar mass [M☉] : 5.463635e8
mass field used : mass# custom look-back windows
snap2 = sfr_snapshot(parts; windows=[5.0, 10.0, 50.0, 100.0])
println("custom windows [Myr] : ", snap2.windows)
println("SFR per window [M☉/yr]: ", snap2.sfr)custom windows [Myr] : [5.0, 10.0, 50.0, 100.0]
SFR per window [M☉/yr]: [1.3736, 1.54955, 1.42157, 1.417555]Depletion time & star-formation efficiency
depletion_time(gas, SFR) combines a gas region with an SFR estimate to return the gas depletion time t_depl = M_gas/SFR, the mass-weighted free-fall time ⟨t_ff⟩, and the efficiency per free-fall time ε_ff = SFR·⟨t_ff⟩/M_gas (Krumholz to McKee). Mask to the star-forming gas to measure its efficiency.
sfr_now = snap.sfr[2]                                  # current SFR from the 10 Myr window [M☉/yr]
d = depletion_time(gas, sfr_now; mask = getvar(gas, :rho, :nH) .> 27)   # dense star-forming gas

println("SFR used        [M☉/yr] : ", d.sfr)
println("M_gas (dense)   [M☉]    : ", d.M_gas_Msol)
println("depletion time  [Gyr]   : ", d.t_depl_Gyr)
println("⟨t_ff⟩ (mass-w)  [Myr]   : ", d.t_ff_mw_Myr)
println("epsilon_ff (KM)         : ", d.eps_ff)
SFR used [M☉/yr] : 1.54955
M_gas (dense) [M☉] : 3.5681431847261477e8
depletion time [Gyr] : 0.2302696385870832
⟨t_ff⟩ (mass-w) [Myr] : 7.170885863082442
epsilon_ff (KM) : 0.03114125642912564The per-cell free-fall time is itself a getvar field :freefall_time (= √(3π/32Gρ)), correct in any time unit.
tff = getvar(gas, :freefall_time, :Myr)
println("per-cell t_ff [Myr] range : ", extrema(tff))
per-cell t_ff [Myr] range : (4.434042095351683, 158141.82257929075)Plot: the star-formation history
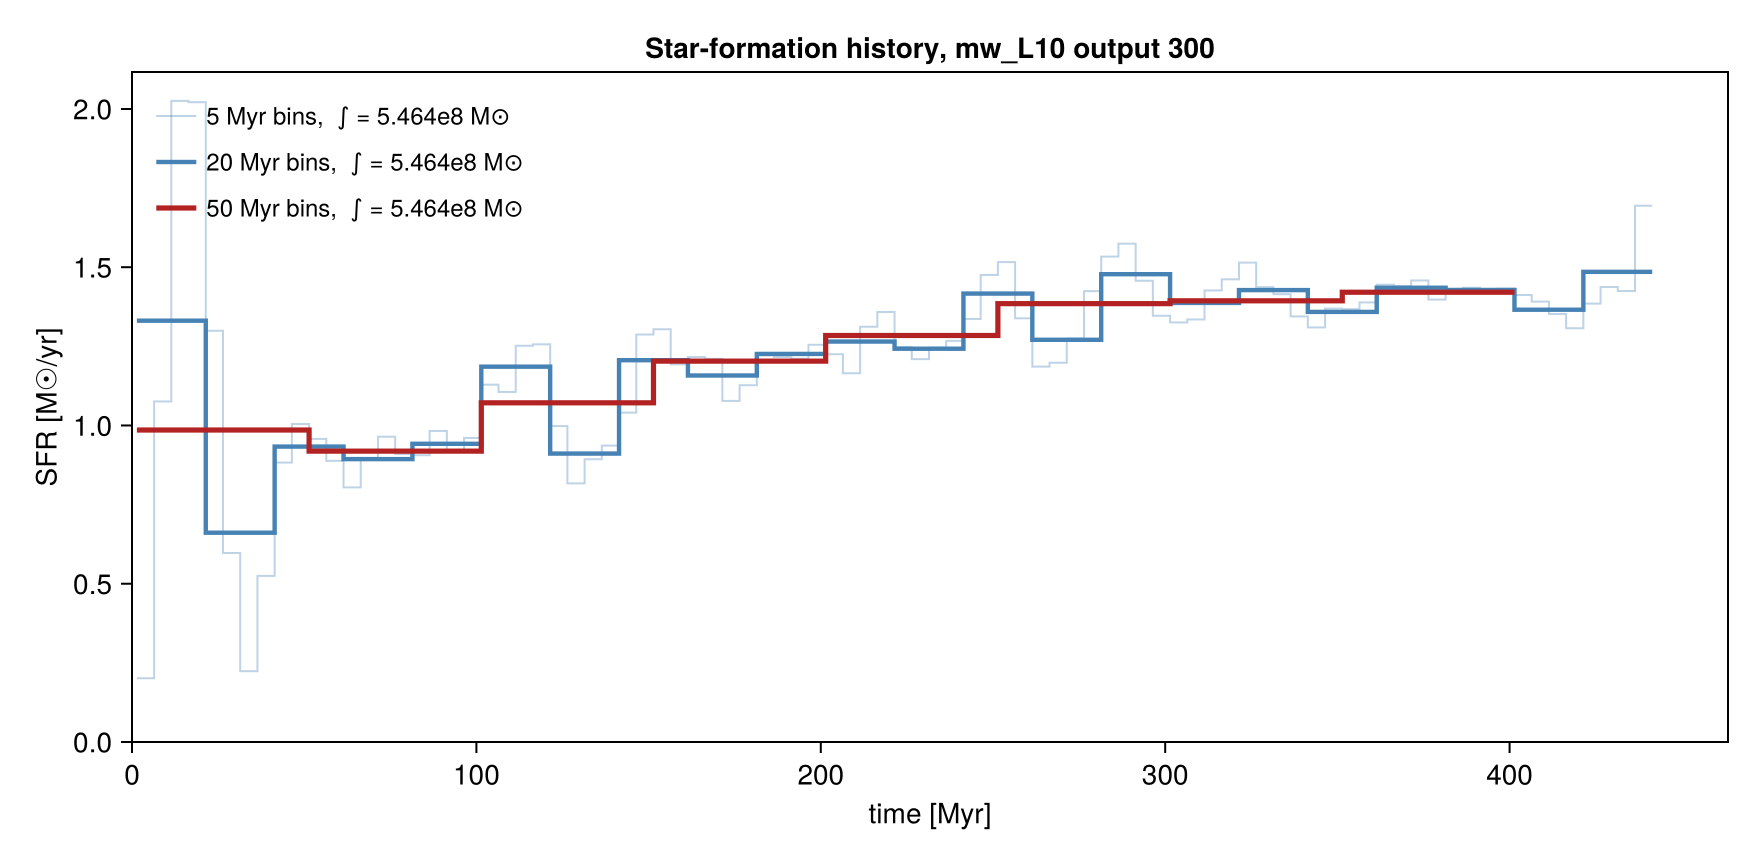
The same history at three bin widths. The coarse curves are running means of the fine one, and the integral printed in the legend is the same for all three: the rate you see depends on the binning, the mass that formed does not. That is the check worth making on any SFH.
The final bin reaches past the youngest star, so it averages over time the run does not cover. It is left out of the curves and kept in the integral.
using CairoMakie

# `t` holds LEFT bin edges. Drop the final bin, which reaches past the youngest star, and close
# the staircase on the right edge of the last complete one.
function steps(t, s, bw)
    n = length(t) - 1
    vcat(t[1:n], t[n] + bw), vcat(s[1:n], s[n])
end

bins  = [5.0, 20.0, 50.0]
style = [(color=(:steelblue, 0.35), linewidth=1.0),
         (color=(:steelblue, 1.00), linewidth=2.2),
         (color=(:firebrick,  1.00), linewidth=2.6)]

fig = Figure(size=(880, 430))
ax  = Axis(fig[1, 1]; xlabel="time [Myr]", ylabel="SFR [M☉/yr]",
           title="Star-formation history, mw_L10 output 300",
           xgridvisible=false, ygridvisible=false)

for (bw, st) in zip(bins, style)
    tb, sb = sfr(parts; tbinsize=bw)
    M      = sum(sb) * bw * 1e6                    # every bin, the partial last one included
    tc, sc = steps(tb, sb, bw)
    stairs!(ax, tc, sc; step=:post, st...,
            label="$(Int(bw)) Myr bins,  \u222b = $(round(M/1e8, digits=3))e8 M\u2299")
end
axislegend(ax; position=:lt, framevisible=false, labelsize=12)
xlims!(ax, 0, nothing); ylims!(ax, 0, nothing)
fig
[ Info: Mera v1.8.0