3. Clumps: Get Sub-Regions of The Loaded Data
Load the Data
using Mera, PyPlot
info = getinfo(400, "../../testing/simulations/manu_sim_sf_L14")
clumps = getclumps(info);
[Mera]: 2020-02-08T20:39:44.033
Code: RAMSES
output [400] summary:
mtime: 2018-09-05T09:51:55.041
ctime: 2019-11-01T17:35:21.051
=======================================================
simulation time: 594.98 [Myr]
boxlen: 48.0 [kpc]
ncpu: 2048
ndim: 3
-------------------------------------------------------
amr: true
level(s): 6 - 14 --> cellsize(s): 750.0 [pc] - 2.93 [pc]
-------------------------------------------------------
hydro: true
hydro-variables: 7 --> (:rho, :vx, :vy, :vz, :p, :var6, :var7)
hydro-descriptor: (:density, :velocity_x, :velocity_y, :velocity_z, :thermal_pressure, :passive_scalar_1, :passive_scalar_2)
γ: 1.6667
-------------------------------------------------------
gravity: true
gravity-variables: (:epot, :ax, :ay, :az)
-------------------------------------------------------
particles: true
- Npart: 5.091500e+05
- Nstars: 5.066030e+05
- Ndm: 2.547000e+03
particle variables: (:vx, :vy, :vz, :mass, :birth)
-------------------------------------------------------
clumps: true
clump-variables: (:index, :lev, :parent, :ncell, :peak_x, :peak_y, :peak_z, Symbol("rho-"), Symbol("rho+"), :rho_av, :mass_cl, :relevance)
-------------------------------------------------------
namelist-file: false
timer-file: false
compilation-file: true
makefile: true
patchfile: true
=======================================================
[Mera]: Get clump data: 2020-02-08T20:39:48.496
domain:
xmin::xmax: 0.0 :: 1.0 ==> 0.0 [kpc] :: 48.0 [kpc]
ymin::ymax: 0.0 :: 1.0 ==> 0.0 [kpc] :: 48.0 [kpc]
zmin::zmax: 0.0 :: 1.0 ==> 0.0 [kpc] :: 48.0 [kpc]
Read 12 colums:
Symbol[:index, :lev, :parent, :ncell, :peak_x, :peak_y, :peak_z, Symbol("rho-"), Symbol("rho+"), :rho_av, :mass_cl, :relevance]
Memory used for data table :61.77734375 KB
-------------------------------------------------------Cuboid Region
Create scatter plots of the full box:
Use the getvar function to extract the positions of the clumps relative to the box center. It returns a dictionary of arrays:
positions = getvar(clumps, [:x, :y, :z], :kpc, center=[:boxcenter], center_unit=:kpc) # units=[:kpc, :kpc, :kpc]
x, y, z = positions[:x], positions[:y], positions[:z]; # assign the three components of the dictionary to three arrays
Alternatively, use the getposition function to extract the positions of the clumps. It returns a tuple of the three components:
x, y, z = getpositions(clumps, :kpc, center=[:boxcenter], center_unit=:kpc); # assign the three components of the tuple to three arraysGet the extent of the processed domain with respect to a given center. The returned tuple is useful declare the specific range of the plots.
rx, ry, rz = getextent(clumps, :kpc, center=[:boxcenter]);Cuboid Region: The red lines show the region that we want to cut-out as a sub-region from the full data:
figure(figsize=(15.5, 3.5))

subplot(1,3,1)
scatter(x,y)
plot([-4.,0.,0.,-4.,-4.],[-15.,-15.,15.,15.,-15.], color="red")
xlim(rx)
ylim(ry)
xlabel("x k[pc]")
ylabel("y [kpc]")


subplot(1,3,2)
scatter(x,z)
plot([-4.,0.,0.,-4.,-4.],[-2.,-2.,2.,2.,-2.], color="red")
xlim(rx)
ylim(rz)
xlabel("x [kpc]")
ylabel("z [kpc]")


subplot(1,3,3)
scatter(y,z)
plot([-15.,15.,15.,-15.,-15.],[-2.,-2.,2.,2.,-2.], color="red")
xlim(ry)
ylim(rz)
xlabel("y [kpc]")
ylabel("z [kpc]");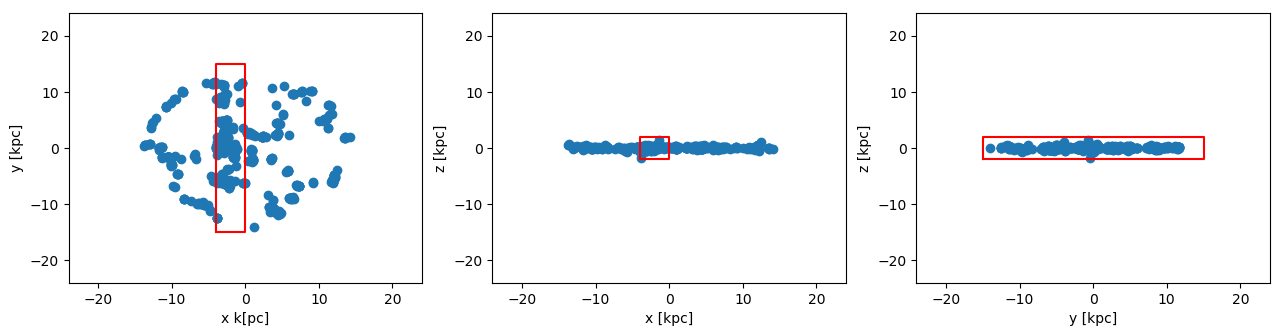
Cuboid Region: Cutout the data assigned to the object clumps
Note: The selected regions can be given relative to a user given center or to the box corner [0., 0., 0.] by default. The user can choose between standard notation 0:1 or physical length-units, defined in e.g. info.scale :
clumps_subregion = subregion( clumps, :cuboid,
                                    xrange=[-4., 0.],
                                    yrange=[-15. ,15.],
                                    zrange=[-2. ,2.],
                                    center=[:boxcenter],
                                    range_unit=:kpc);
[Mera]: 2020-02-08T20:40:04.755
center: [0.5, 0.5, 0.5] ==> [24.0 [kpc] :: 24.0 [kpc] :: 24.0 [kpc]]
domain:
xmin::xmax: 0.4166667 :: 0.5 ==> 20.0 [kpc] :: 24.0 [kpc]
ymin::ymax: 0.1875 :: 0.8125 ==> 9.0 [kpc] :: 39.0 [kpc]
zmin::zmax: 0.4583333 :: 0.5416667 ==> 22.0 [kpc] :: 26.0 [kpc]
Memory used for data table :29.52734375 KB
-------------------------------------------------------The function subregion creates a new object with the same type as the object created by the function getclumps :
typeof(clumps_subregion)ClumpDataTypeCuboid Region: Scatter-Plots of the sub-region.
The coordinates center is the center of the box by default:
x, y, z    = getpositions(clumps_subregion, :kpc, center=[:boxcenter]); # clump positions of the subregion
rx, ry, rz = getextent(clumps, :kpc, center=[:boxcenter] ); # extent of the box
figure(figsize=(15.5, 3.5))
subplot(1,3,1)
scatter(x,y)
plot([-4.,0.,0.,-4.,-4.],[-15.,-15.,15.,15.,-15.], color="red")
xlim(rx)
ylim(ry)
xlabel("x k[pc]")
ylabel("y [kpc]")
subplot(1,3,2)
scatter(x,z)
plot([-4.,0.,0.,-4.,-4.],[-2.,-2.,2.,2.,-2.], color="red")
xlim(rx)
ylim(rz)
xlabel("x [kpc]")
ylabel("z [kpc]")
subplot(1,3,3)
scatter(y,z)
plot([-15.,15.,15.,-15.,-15.],[-2.,-2.,2.,2.,-2.], color="red")
xlim(ry)
ylim(rz)
xlabel("y [kpc]")
ylabel("z [kpc]");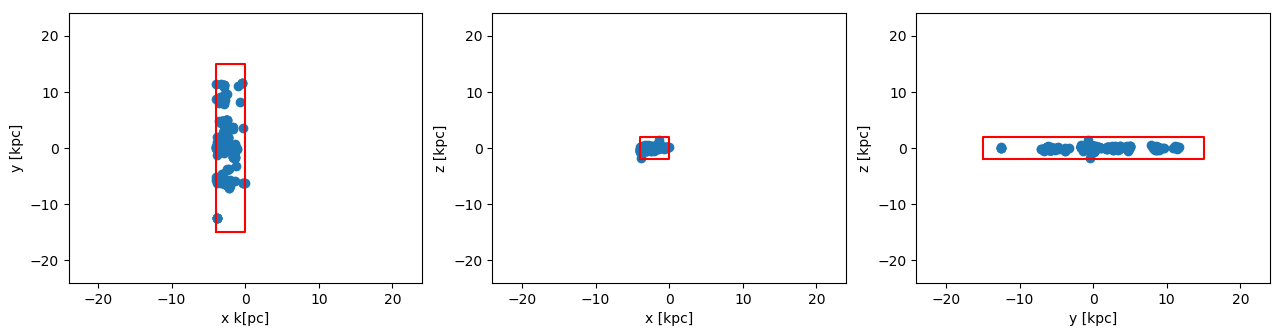
Cuboid Region: Get the extent of the subregion data ranges
rx_sub, ry_sub, rz_sub = getextent(clumps_subregion, :kpc, center=[:boxcenter]); # extent of the subregionfigure(figsize=(15.5, 3.5))
subplot(1,3,1)
scatter(x,y)
xlim(rx_sub)
ylim(ry_sub)
xlabel("x [kpc]")
ylabel("y [kpc]")
subplot(1,3,2)
scatter(x,z)
xlim(rx_sub)
ylim(rz_sub)
xlabel("x [kpc]")
ylabel("z [kpc]")
subplot(1,3,3)
scatter(y,z)
xlim(ry_sub)
ylim(rz_sub)
xlabel("y [kpc]")
ylabel("z [kpc]");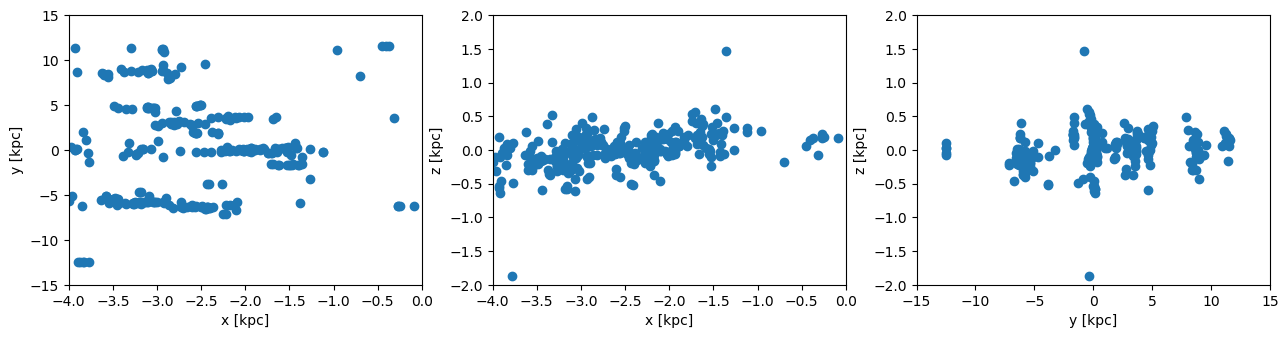
Cuboid Region: Get the data outside of the selected region (inverse selection):
clumps_subregion = subregion( clumps, :cuboid,
                                    xrange=[-4., 0.],
                                    yrange=[-15. ,15.],
                                    zrange=[-2. ,2.],
                                    center=[:boxcenter],
                                    range_unit=:kpc,
                                    inverse=true);
[Mera]: 2020-02-08T20:40:36.521
center: [0.5, 0.5, 0.5] ==> [24.0 [kpc] :: 24.0 [kpc] :: 24.0 [kpc]]
domain:
xmin::xmax: 0.4166667 :: 0.5 ==> 20.0 [kpc] :: 24.0 [kpc]
ymin::ymax: 0.1875 :: 0.8125 ==> 9.0 [kpc] :: 39.0 [kpc]
zmin::zmax: 0.4583333 :: 0.5416667 ==> 22.0 [kpc] :: 26.0 [kpc]
Memory used for data table :33.65234375 KB
-------------------------------------------------------x, y, z = getpositions(clumps_subregion, :kpc, center=[:boxcenter]);
rx_sub, ry_sub, rz_sub = getextent(clumps_subregion, :kpc, center=[:boxcenter]);figure(figsize=(15.5, 3.5))
subplot(1,3,1)
scatter(x,y)
plot([-4.,0.,0.,-4.,-4.],[-15.,-15.,15.,15.,-15.], color="red")
xlim(rx_sub)
ylim(ry_sub)
xlabel("x [kpc]")
ylabel("y [kpc]")
subplot(1,3,2)
scatter(x,z)
plot([-4.,0.,0.,-4.,-4.],[-2.,-2.,2.,2.,-2.], color="red")
xlim(rx_sub)
ylim(rz_sub)
xlabel("x [kpc]")
ylabel("z [kpc]")
subplot(1,3,3)
scatter(y,z)
plot([-15.,15.,15.,-15.,-15.],[-2.,-2.,2.,2.,-2.], color="red")
xlim(ry_sub)
ylim(rz_sub)
xlabel("y [kpc]")
ylabel("z [kpc]");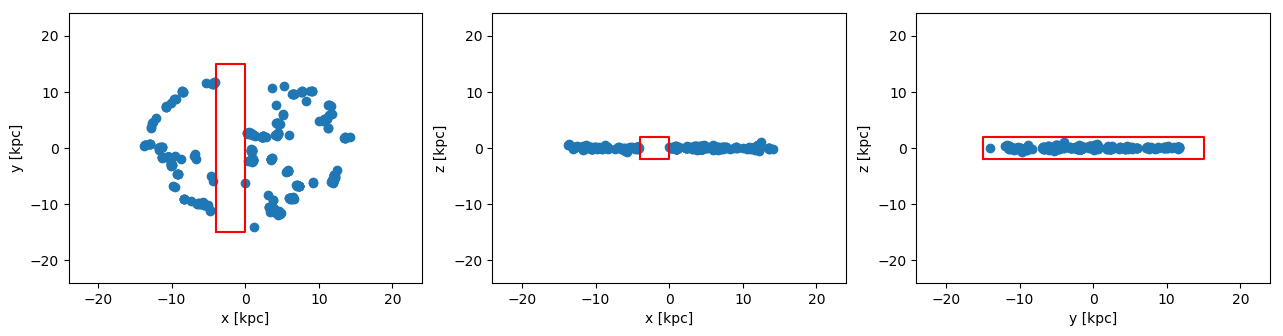
Cylindrical Region
Extract the the clump positions and the extent of the full box:
clumps  = getclumps(info);
x, y, z = getpositions(clumps, :kpc, center=[:boxcenter]);
rx, ry, rz = getextent(clumps, :kpc, center=[:boxcenter]);
[Mera]: Get clump data: 2020-02-08T20:40:43.377
domain:
xmin::xmax: 0.0 :: 1.0 ==> 0.0 [kpc] :: 48.0 [kpc]
ymin::ymax: 0.0 :: 1.0 ==> 0.0 [kpc] :: 48.0 [kpc]
zmin::zmax: 0.0 :: 1.0 ==> 0.0 [kpc] :: 48.0 [kpc]
Read 12 colums:
Symbol[:index, :lev, :parent, :ncell, :peak_x, :peak_y, :peak_z, Symbol("rho-"), Symbol("rho+"), :rho_av, :mass_cl, :relevance]
Memory used for data table :61.77734375 KB
-------------------------------------------------------Cylindrical Region: The red lines show the region that we want to cut-out as a sub-region from the full data:
figure(figsize=(15.5, 3.5))
theta = range(-pi, stop=pi, length=100)

subplot(1,3,1)
scatter(x,y)
plot( 3. .* sin.(theta) .-11, 3 .* cos.(theta), color="red")
xlim(rx)
ylim(ry)
xlabel("x k[pc]")
ylabel("y [kpc]")


subplot(1,3,2)
scatter(x,z)
plot([-3.,3.,3.,-3.,-3.] .-11.,[-2.,-2.,2.,2.,-2.], color="red")
xlim(rx)
ylim(rz)
xlabel("x [kpc]")
ylabel("z [kpc]")


subplot(1,3,3)
scatter(y,z)
plot([-3.,3.,3.,-3.,-3.],[-2.,-2.,2.,2.,-2.], color="red")
xlim(ry)
ylim(rz)
xlabel("y [kpc]")
ylabel("z [kpc]");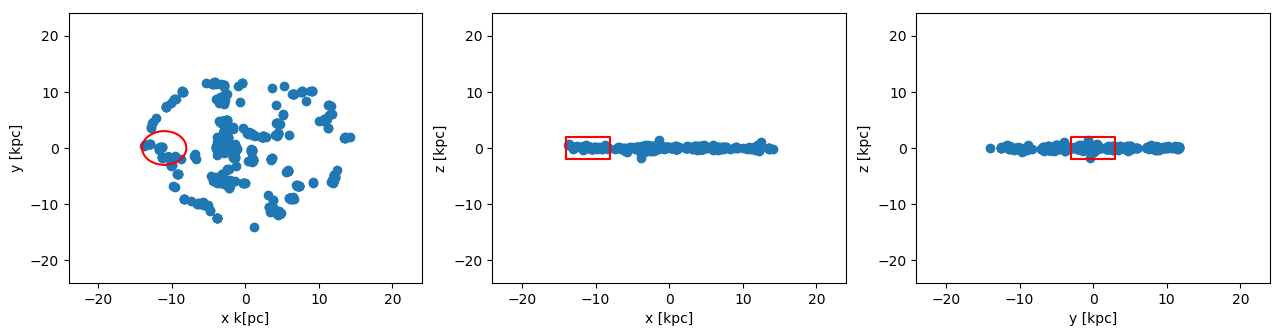
Cylindrical Region: Cutout the data assigned to the object clumps
Select the ranges of the cylinder in the unit "kpc", relative to the given center [13., 24., 24.]. The height refers to both z-directions from the plane.
clumps_subregion = subregion( clumps, :cylinder,
                                radius=3.,
                                height=2.,
                                range_unit=:kpc,
                                center=[(24. -11.), :bc, :bc]); # direction=:z, by default
[Mera]: 2020-02-08T20:40:50.168
center: [0.2708333, 0.5, 0.5] ==> [13.0 [kpc] :: 24.0 [kpc] :: 24.0 [kpc]]
domain:
xmin::xmax: 0.2083333 :: 0.3333333 ==> 10.0 [kpc] :: 16.0 [kpc]
ymin::ymax: 0.4375 :: 0.5625 ==> 21.0 [kpc] :: 27.0 [kpc]
zmin::zmax: 0.4583333 :: 0.5416667 ==> 22.0 [kpc] :: 26.0 [kpc]
Radius: 3.0 [kpc]
Height: 2.0 [kpc]
Memory used for data table :5.24609375 KB
-------------------------------------------------------Extract the the clump positions of the subregion and the extent of the full box:
x, y, z    = getpositions(clumps_subregion, :kpc, center=[:boxcenter])
rx, ry, rz = getextent(clumps, :kpc, center=[:boxcenter]);
figure(figsize=(15.5, 3.5))
theta = range(-pi, stop=pi, length=100)
subplot(1,3,1)
scatter(x,y)
plot( 3. .* sin.(theta) .-11, 3 .* cos.(theta), color="red")
xlim(rx)
ylim(ry)
xlabel("x k[pc]")
ylabel("y [kpc]")
subplot(1,3,2)
scatter(x,z)
plot([-3.,3.,3.,-3.,-3.] .-11.,[-2.,-2.,2.,2.,-2.], color="red")
xlim(rx)
ylim(rz)
xlabel("x [kpc]")
ylabel("z [kpc]")
subplot(1,3,3)
scatter(y,z)
plot([-3.,3.,3.,-3.,-3.],[-2.,-2.,2.,2.,-2.], color="red")
xlim(ry)
ylim(rz)
xlabel("y [kpc]")
ylabel("z [kpc]");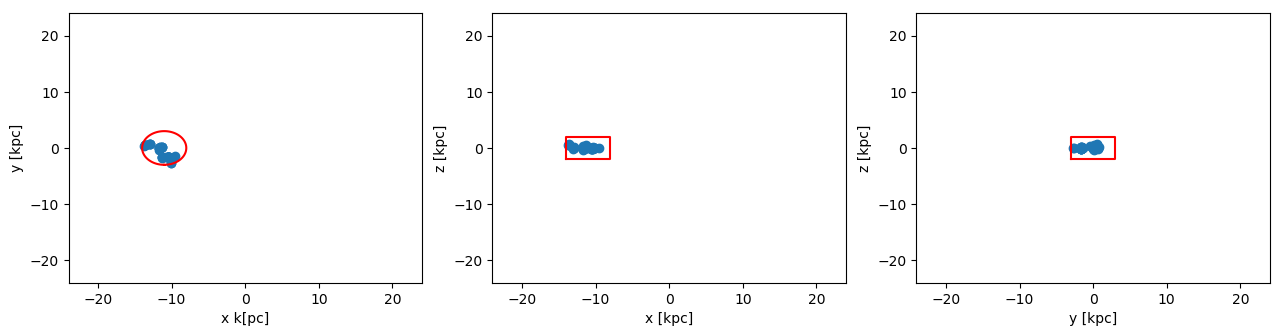
Cylindrical Region: Scatter-Plot of the selected data range with respect to the center of the sub-region:
x, y, z    = getpositions(clumps_subregion, :kpc,
                            center=[ (24. -11.), :bc, :bc],
                            center_unit=:kpc);
rx_sub, ry_sub, rz_sub = getextent(clumps_subregion, :kpc,
                                    center=[ (24. -11.), :bc, :bc],
                                    center_unit=:kpc);
figure(figsize=(15.5, 3.5))
theta = range(-pi, stop=pi, length=100)
subplot(1,3,1)
scatter(x,y)
plot( 3. .* sin.(theta), 3 .* cos.(theta), color="red")
xlim(rx_sub)
ylim(ry_sub)
xlabel("kpc")
ylabel("kpc")
subplot(1,3,2)
scatter(x,z)
xlim(rx_sub)
ylim(rz_sub)
xlabel("kpc")
ylabel("kpc")
subplot(1,3,3)
scatter(y,z)
xlim(ry_sub)
ylim(rz_sub)
xlabel("kpc")
ylabel("kpc");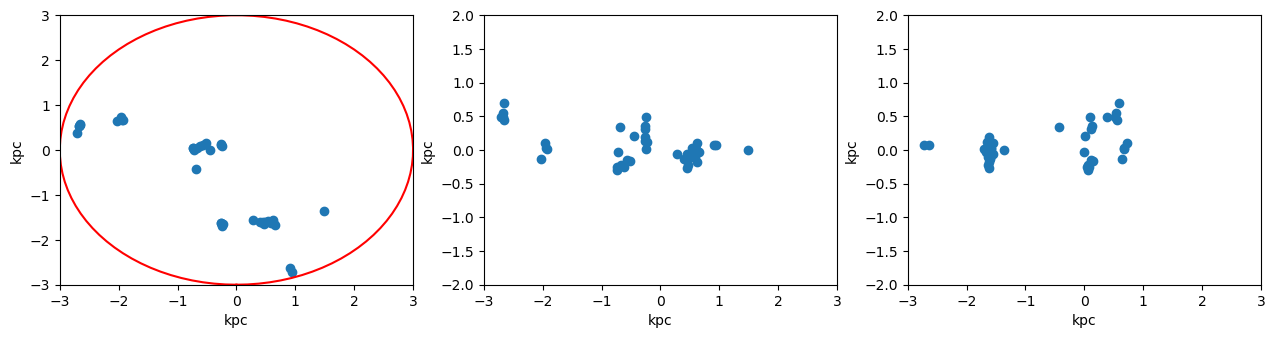
Cylindrical Region: Get the data outside of the selected region (inverse selection):
clumps_subregion = subregion( clumps, :cylinder,
                            radius=3.,
                            height=2.,
                            range_unit=:kpc,
                            center=[ (24. -11.),:bc,:bc],
                            inverse=true);
[Mera]: 2020-02-08T20:41:13.553
center: [0.2708333, 0.5, 0.5] ==> [13.0 [kpc] :: 24.0 [kpc] :: 24.0 [kpc]]
domain:
xmin::xmax: 0.2083333 :: 0.3333333 ==> 10.0 [kpc] :: 16.0 [kpc]
ymin::ymax: 0.4375 :: 0.5625 ==> 21.0 [kpc] :: 27.0 [kpc]
zmin::zmax: 0.4583333 :: 0.5416667 ==> 22.0 [kpc] :: 26.0 [kpc]
Radius: 3.0 [kpc]
Height: 2.0 [kpc]
Memory used for data table :57.93359375 KB
-------------------------------------------------------x, y, z = getpositions(clumps_subregion, :kpc, center=[:boxcenter]);
rx_sub, ry_sub, rz_sub = getextent(clumps_subregion, :kpc, center=[:boxcenter]);figure(figsize=(15.5, 3.5))
theta = range(-pi, stop=pi, length=100)
subplot(1,3,1)
scatter(x,y)
plot( 3. .* sin.(theta) .-11, 3 .* cos.(theta), color="red")
xlim(rx)
ylim(ry)
xlabel("x k[pc]")
ylabel("y [kpc]")
subplot(1,3,2)
scatter(x,z)
plot([-3.,3.,3.,-3.,-3.] .-11.,[-2.,-2.,2.,2.,-2.], color="red")
xlim(rx)
ylim(rz)
xlabel("x [kpc]")
ylabel("z [kpc]")
subplot(1,3,3)
scatter(y,z)
plot([-3.,3.,3.,-3.,-3.],[-2.,-2.,2.,2.,-2.], color="red")
xlim(ry)
ylim(rz)
xlabel("y [kpc]")
ylabel("z [kpc]");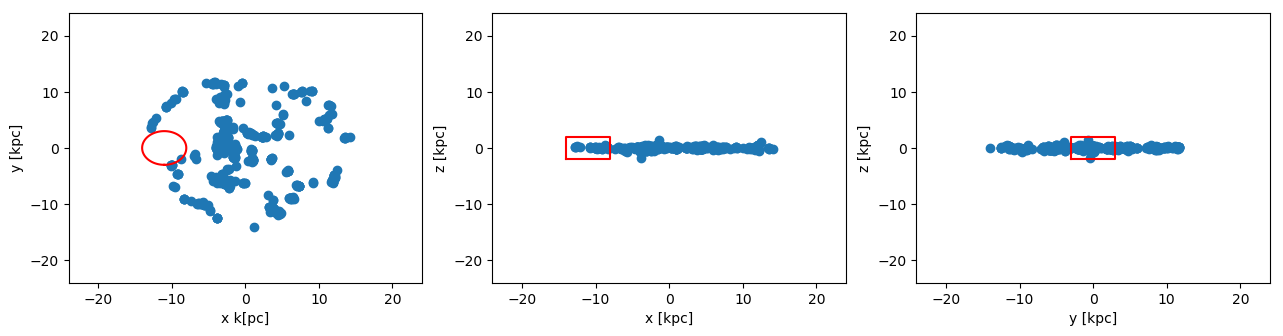
Spherical Region
Extract the the clump positions and the extent of the full box:
clumps  = getclumps(info);
x, y, z = getpositions(clumps, :kpc, center=[:boxcenter]);
rx, ry, rz = getextent(clumps, :kpc, center=[:boxcenter]);
[Mera]: Get clump data: 2020-02-08T20:41:17.127
domain:
xmin::xmax: 0.0 :: 1.0 ==> 0.0 [kpc] :: 48.0 [kpc]
ymin::ymax: 0.0 :: 1.0 ==> 0.0 [kpc] :: 48.0 [kpc]
zmin::zmax: 0.0 :: 1.0 ==> 0.0 [kpc] :: 48.0 [kpc]
Read 12 colums:
Symbol[:index, :lev, :parent, :ncell, :peak_x, :peak_y, :peak_z, Symbol("rho-"), Symbol("rho+"), :rho_av, :mass_cl, :relevance]
Memory used for data table :61.77734375 KB
-------------------------------------------------------The red lines show the region that we want to cut-out as a sub-region from the full data:
figure(figsize=(15.5, 3.5))

theta = range(-pi, stop=pi, length=100)

subplot(1,3,1)
scatter(x,y)
plot( 10. .* sin.(theta) .-11., 10 .* cos.(theta), color="red")
xlim(rx)
ylim(ry)
xlabel("x [kpc]")
ylabel("y [kpc]")


subplot(1,3,2)
scatter(x,z)
plot( 10. .* sin.(theta) .-11., 10 .* cos.(theta), color="red")
xlim(rx)
ylim(rz)
xlabel("x [kpc]")
ylabel("z [kpc]")


subplot(1,3,3)
scatter(y,z)
plot( 10. .* sin.(theta) , 10 .* cos.(theta), color="red")
xlim(ry)
ylim(rz)
xlabel("y [kpc]")
ylabel("z [kpc]")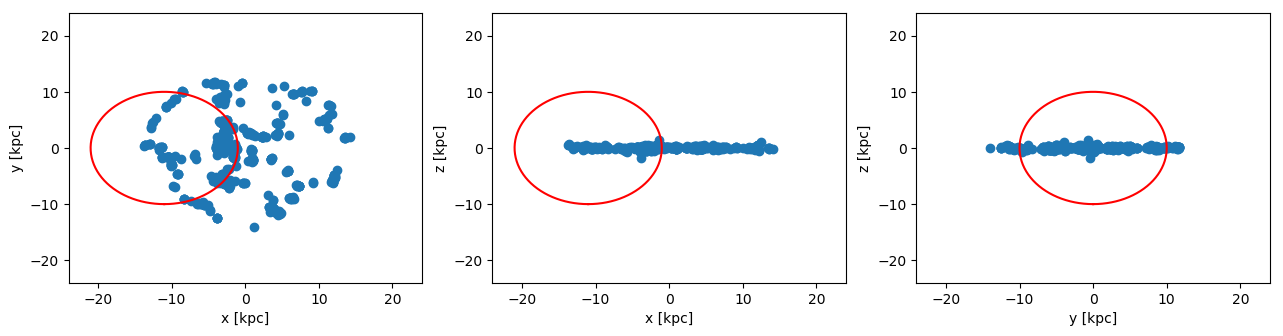
PyObject Text(871.9411764705884, 0.5, 'z [kpc]')Spherical Region: Cutout the data assigned to the object clumps
Select the radius of the sphere in the unit "kpc", relative to the given center [13., 24., 24.]:
clumps_subregion = subregion( clumps, :sphere,
                                     radius=10.,
                                     range_unit=:kpc,
                                     center=[ (24. -11.),:bc, :bc]);
[Mera]: 2020-02-08T20:41:21.728
center: [0.2708333, 0.5, 0.5] ==> [13.0 [kpc] :: 24.0 [kpc] :: 24.0 [kpc]]
domain:
xmin::xmax: 0.0625 :: 0.4791667 ==> 3.0 [kpc] :: 23.0 [kpc]
ymin::ymax: 0.2916667 :: 0.7083333 ==> 14.0 [kpc] :: 34.0 [kpc]
zmin::zmax: 0.2916667 :: 0.7083333 ==> 14.0 [kpc] :: 34.0 [kpc]
Radius: 10.0 [kpc]
Memory used for data table :28.68359375 KB
-------------------------------------------------------x, y, z = getpositions(clumps_subregion, :kpc, center=[:boxcenter]); # subregion
rx, ry, rz = getextent(clumps, :kpc, center=[:boxcenter]); # full boxfigure(figsize=(15.5, 3.5))
theta = range(-pi, stop=pi, length=100)
subplot(1,3,1)
scatter(x,y)
plot( 10. .* sin.(theta) .-11., 10 .* cos.(theta), color="red")
xlim(rx)
ylim(ry)
xlabel("x [kpc]")
ylabel("y [kpc]")
subplot(1,3,2)
scatter(x,z)
plot( 10. .* sin.(theta) .-11., 10 .* cos.(theta), color="red")
xlim(rx)
ylim(rz)
xlabel("x [kpc]")
ylabel("z [kpc]")
subplot(1,3,3)
scatter(y,z)
plot( 10. .* sin.(theta) , 10 .* cos.(theta), color="red")
xlim(ry)
ylim(rz)
xlabel("y [kpc]")
ylabel("z [kpc]");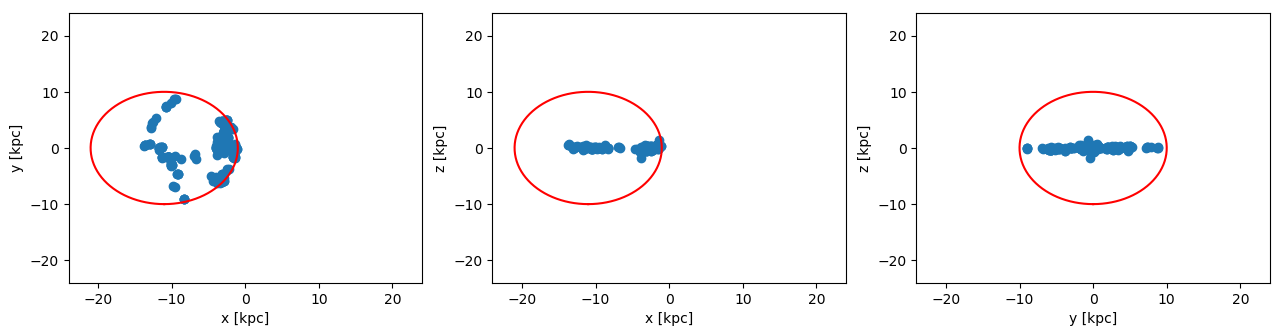
Spherical Region: Scatter-Plot of the selected data range with respect to the center of the sub-region:
x, y, z    = getpositions(clumps_subregion, :kpc,
                            center=[ (24. -11.), :bc, :bc],
                            center_unit=:kpc); # subregion
rx_sub, ry_sub, rz_sub = getextent(clumps_subregion, :kpc,
                            center=[(24. -11.), :bc, :bc],
                            center_unit=:kpc); # subregion
figure(figsize=(15.5, 3.5))
theta = range(-pi, stop=pi, length=100)
subplot(1,3,1)
scatter(x,y)
plot( 10. .* sin.(theta), 10 .* cos.(theta), color="red")
xlim(rx_sub)
ylim(ry_sub)
xlabel("x [kpc]")
ylabel("y [kpc]")
subplot(1,3,2)
scatter(x,z)
plot( 10. .* sin.(theta), 10 .* cos.(theta), color="red")
xlim(rx_sub)
ylim(rz_sub)
xlabel("x [kpc]")
ylabel("z [kpc]")
subplot(1,3,3)
scatter(y,z)
plot( 10. .* sin.(theta), 10 .* cos.(theta), color="red")
xlim(ry_sub)
ylim(rz_sub)
xlabel("y [kpc]")
ylabel("z [kpc]");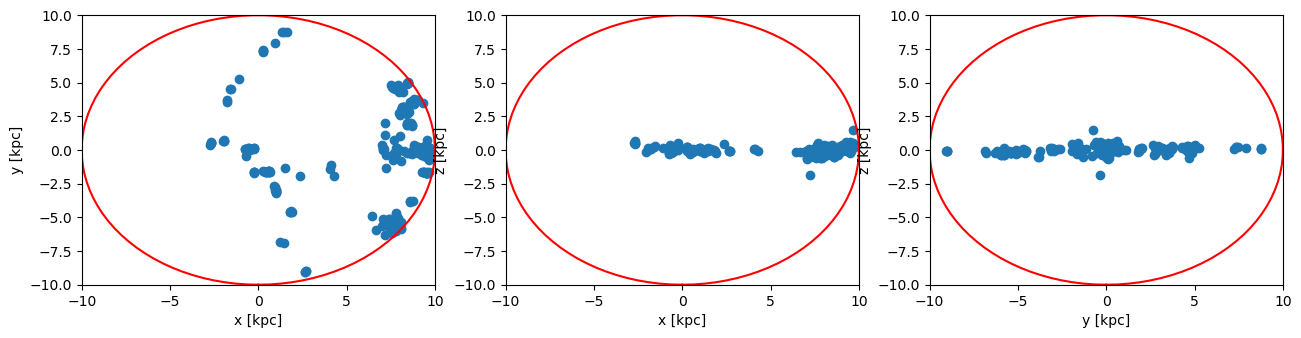
Spherical Region: Get the data outside of the selected region (inverse selection):
clumps_subregion = subregion( clumps, :sphere,
                                     radius=10.,
                                     range_unit=:kpc,
                                     center=[ (24. -11.),:bc,:bc],
                                     inverse=true);
[Mera]: 2020-02-08T20:41:43.641
center: [0.2708333, 0.5, 0.5] ==> [13.0 [kpc] :: 24.0 [kpc] :: 24.0 [kpc]]
domain:
xmin::xmax: 0.0625 :: 0.4791667 ==> 3.0 [kpc] :: 23.0 [kpc]
ymin::ymax: 0.2916667 :: 0.7083333 ==> 14.0 [kpc] :: 34.0 [kpc]
zmin::zmax: 0.2916667 :: 0.7083333 ==> 14.0 [kpc] :: 34.0 [kpc]
Radius: 10.0 [kpc]
Memory used for data table :34.49609375 KB
-------------------------------------------------------x, y, z = getpositions(clumps_subregion, :kpc, center=[:boxcenter]);
rx_sub, ry_sub, rz_sub = getextent(clumps_subregion, :kpc, center=[:boxcenter]);figure(figsize=(15.5, 3.5))
theta = range(-pi, stop=pi, length=100)
subplot(1,3,1)
scatter(x,y)
plot( 10. .* sin.(theta) .-11., 10 .* cos.(theta), color="red")
xlim(rx)
ylim(ry)
xlabel("x [kpc]")
ylabel("y [kpc]")
subplot(1,3,2)
scatter(x,z)
plot( 10. .* sin.(theta) .-11., 10 .* cos.(theta), color="red")
xlim(rx)
ylim(rz)
xlabel("x [kpc]")
ylabel("z [kpc]")
subplot(1,3,3)
scatter(y,z)
plot( 10. .* sin.(theta) , 10 .* cos.(theta), color="red")
xlim(ry)
ylim(rz)
xlabel("y [kpc]")
ylabel("z [kpc]")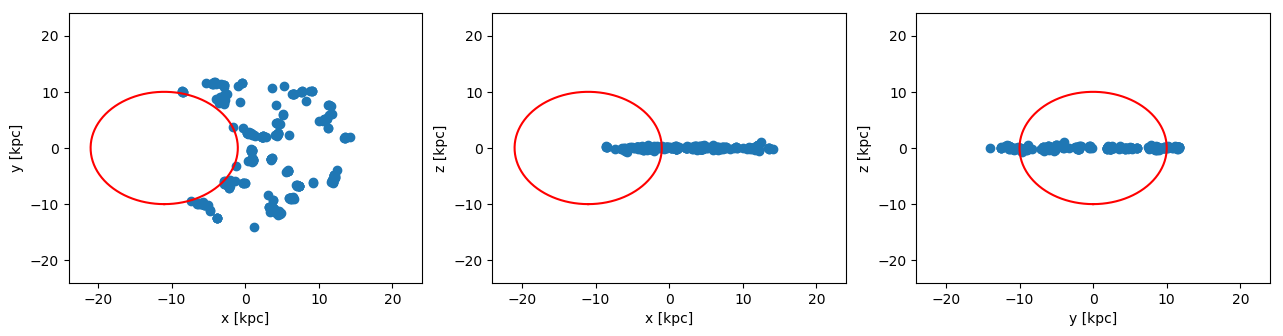
PyObject Text(871.9411764705884, 0.5, 'z [kpc]')Combined/Nested/Shell Sub-Regions
The sub-region functions can be used in any combination with each other! (Combined with overlapping ranges or nested)
Cylindrical Shell
Extract the the clump positions and the extent of the full box:
clumps = getclumps(info);
x, y, z = getpositions(clumps, :kpc, center=[:boxcenter]);
rx, ry, rz = getextent(clumps, :kpc, center=[:boxcenter]);
[Mera]: Get clump data: 2020-02-08T20:41:52.553
domain:
xmin::xmax: 0.0 :: 1.0 ==> 0.0 [kpc] :: 48.0 [kpc]
ymin::ymax: 0.0 :: 1.0 ==> 0.0 [kpc] :: 48.0 [kpc]
zmin::zmax: 0.0 :: 1.0 ==> 0.0 [kpc] :: 48.0 [kpc]
Read 12 colums:
Symbol[:index, :lev, :parent, :ncell, :peak_x, :peak_y, :peak_z, Symbol("rho-"), Symbol("rho+"), :rho_av, :mass_cl, :relevance]
Memory used for data table :61.77734375 KB
-------------------------------------------------------The red lines show the shell that we want to cut-out as a sub-region from the full data:
figure(figsize=(15.5, 3.5))
theta = range(-pi, stop=pi, length=100)

subplot(1,3,1)
scatter(x,y)
plot( 10. .* sin.(theta) , 10 .* cos.(theta), color="red")
plot( 5. .* sin.(theta) , 5. .* cos.(theta), color="red", ls="--")
xlim(rx)
ylim(ry)
xlabel("x k[pc]")
ylabel("y [kpc]")


subplot(1,3,2)
scatter(x,z)
plot([-10.,-10.,10.,10.,-10.], [-2.,2.,2.,-2.,-2.], color="red")
plot([-5.,-5,5.,5.,-5.], [-2.,2.,2.,-2.,-2.], color="red", ls="--")
xlim(rx)
ylim(rz)
xlabel("x [kpc]")
ylabel("z [kpc]")


subplot(1,3,3)
scatter(y,z)
plot([-10.,-10.,10.,10.,-10.], [-2.,2.,2.,-2.,-2.], color="red")
plot([-5.,-5,5.,5.,-5.], [-2.,2.,2.,-2.,-2.], color="red",ls = "--")
xlim(ry)
ylim(rz)
xlabel("y [kpc]")
ylabel("z [kpc]");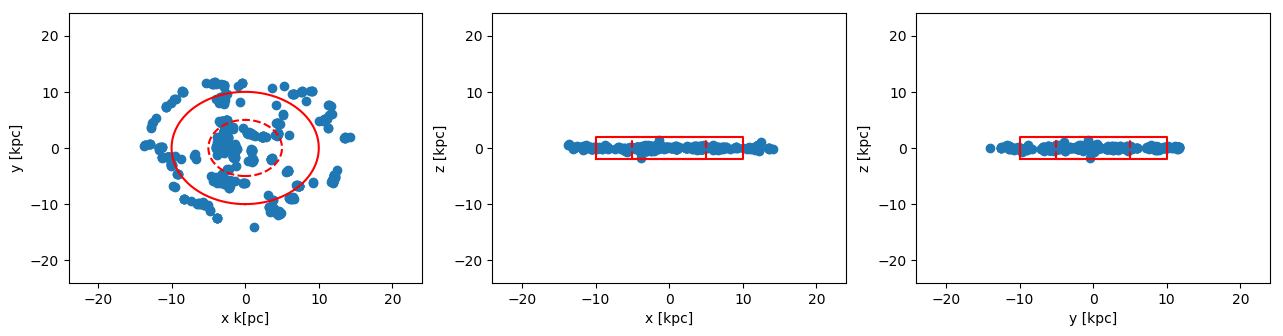
Cylindrical Shell:
Pass the height of the cylinder and the inner/outer radius of the shell in the unit "kpc", relative to the box center [24., 24., 24.]:
clumps_subregion = shellregion( clumps, :cylinder,
                                         radius=[5.,10.],
                                         height=2.,
                                         range_unit=:kpc,
                                         center=[:boxcenter]);
[Mera]: 2020-02-08T20:42:00.413
center: [0.5, 0.5, 0.5] ==> [24.0 [kpc] :: 24.0 [kpc] :: 24.0 [kpc]]
domain:
xmin::xmax: 0.2916667 :: 0.7083333 ==> 14.0 [kpc] :: 34.0 [kpc]
ymin::ymax: 0.2916667 :: 0.7083333 ==> 14.0 [kpc] :: 34.0 [kpc]
zmin::zmax: 0.4583333 :: 0.5416667 ==> 22.0 [kpc] :: 26.0 [kpc]
Inner radius: 5.0 [kpc]
Outer radius: 10.0 [kpc]
Radius diff: 5.0 [kpc]
Height: 2.0 [kpc]
Memory used for data table :18.55859375 KB
-------------------------------------------------------x, y, z = getpositions(clumps_subregion, :kpc, center=[:boxcenter]); # shellregion
rx, ry, rz = getextent(clumps, :kpc, center=[:boxcenter]); # full boxfigure(figsize=(15.5, 3.5))
theta = range(-pi, stop=pi, length=100)
subplot(1,3,1)
scatter(x,y)
plot( 10. .* sin.(theta) , 10 .* cos.(theta), color="red")
plot( 5. .* sin.(theta) , 5. .* cos.(theta), color="red", ls="--")
xlim(rx)
ylim(ry)
xlabel("x k[pc]")
ylabel("y [kpc]")
subplot(1,3,2)
scatter(x,z)
plot([-10.,-10.,10.,10.,-10.], [-2.,2.,2.,-2.,-2.], color="red")
plot([-5.,-5,5.,5.,-5.], [-2.,2.,2.,-2.,-2.], color="red", ls="--")
xlim(rx)
ylim(rz)
xlabel("x [kpc]")
ylabel("z [kpc]")
subplot(1,3,3)
scatter(y,z)
plot([-10.,-10.,10.,10.,-10.], [-2.,2.,2.,-2.,-2.], color="red")
plot([-5.,-5,5.,5.,-5.], [-2.,2.,2.,-2.,-2.], color="red", ls="--")
xlim(ry)
ylim(rz)
xlabel("y [kpc]")
ylabel("z [kpc]");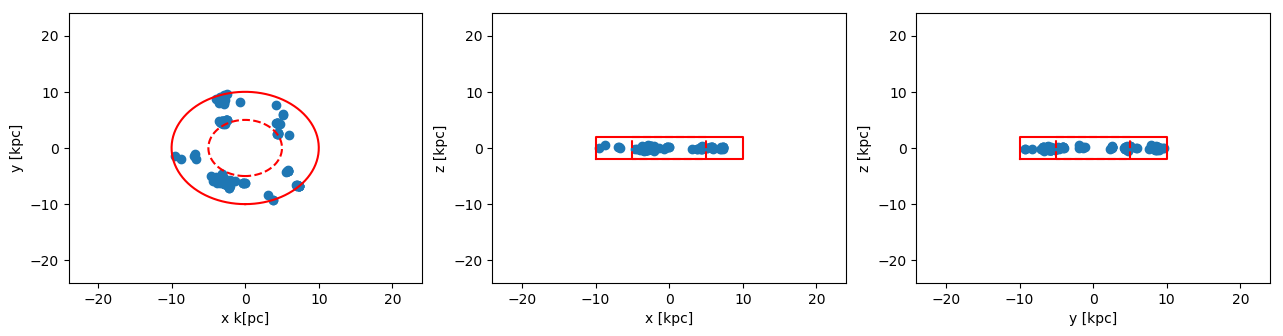
Cylindrical Shell: Get the data outside of the selected shell-region (inverse selection):
clumps_subregion = shellregion( clumps, :cylinder,
                                         radius=[5.,10.],
                                         height=2.,
                                         range_unit=:kpc,
                                         center=[:boxcenter],
                                         inverse=true);
[Mera]: 2020-02-08T20:42:10.055
center: [0.5, 0.5, 0.5] ==> [24.0 [kpc] :: 24.0 [kpc] :: 24.0 [kpc]]
domain:
xmin::xmax: 0.2916667 :: 0.7083333 ==> 14.0 [kpc] :: 34.0 [kpc]
ymin::ymax: 0.2916667 :: 0.7083333 ==> 14.0 [kpc] :: 34.0 [kpc]
zmin::zmax: 0.4583333 :: 0.5416667 ==> 22.0 [kpc] :: 26.0 [kpc]
Inner radius: 5.0 [kpc]
Outer radius: 10.0 [kpc]
Radius diff: 5.0 [kpc]
Height: 2.0 [kpc]
Memory used for data table :44.62109375 KB
-------------------------------------------------------x, y, z = getpositions(clumps_subregion, :kpc, center=[:boxcenter]); # shellregion
rx, ry, rz = getextent(clumps, :kpc, center=[:boxcenter]); # full boxfigure(figsize=(15.5, 3.5))
theta = range(-pi, stop=pi, length=100)
subplot(1,3,1)
scatter(x,y)
plot( 10. .* sin.(theta) , 10 .* cos.(theta), color="red")
plot( 5. .* sin.(theta) , 5. .* cos.(theta), color="red", ls="--")
xlim(rx)
ylim(ry)
xlabel("x k[pc]")
ylabel("y [kpc]")
subplot(1,3,2)
scatter(x,z)
plot([-10.,-10.,10.,10.,-10.], [-2.,2.,2.,-2.,-2.], color="red")
plot([-5.,-5,5.,5.,-5.], [-2.,2.,2.,-2.,-2.], color="red", ls="--")
xlim(rx)
ylim(rz)
xlabel("x [kpc]")
ylabel("z [kpc]")
subplot(1,3,3)
scatter(y,z)
plot([-10.,-10.,10.,10.,-10.], [-2.,2.,2.,-2.,-2.], color="red")
plot([-5.,-5,5.,5.,-5.], [-2.,2.,2.,-2.,-2.], color="red", ls="--")
xlim(ry)
ylim(rz)
xlabel("y [kpc]")
ylabel("z [kpc]");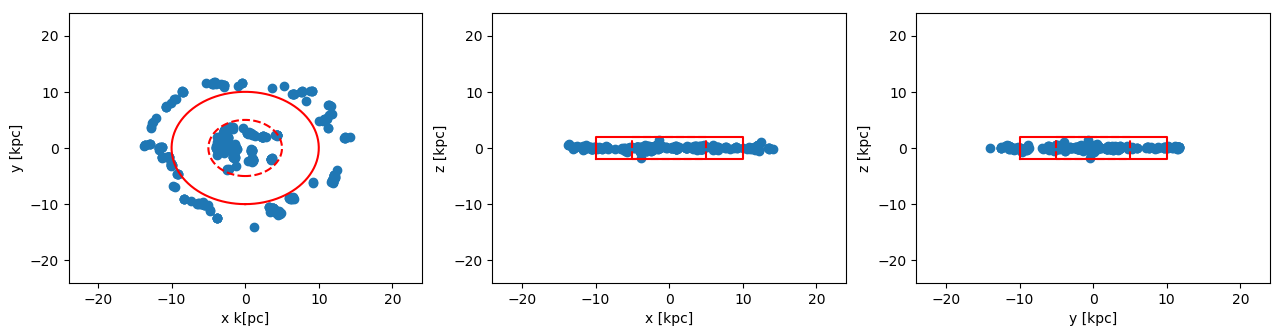
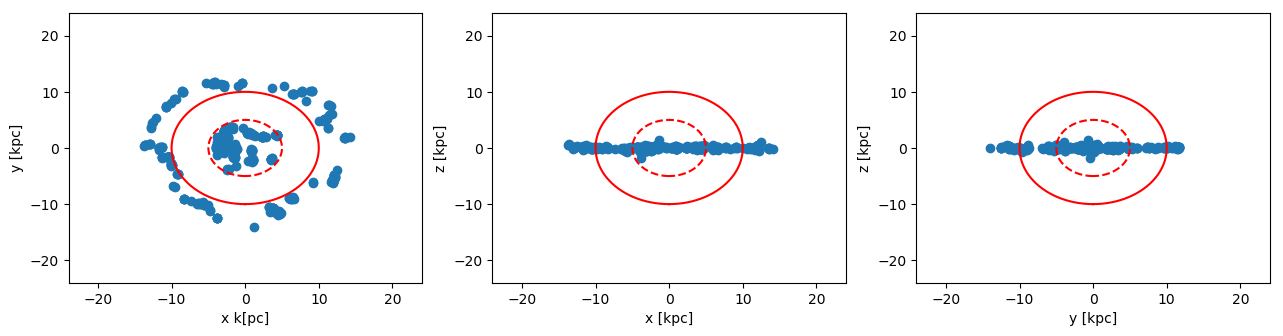
Spherical Shell
Extract the the clump positions and the extent of the full box:
clumps  = getclumps(info);
x, y, z = getpositions(clumps, :kpc, center=[:boxcenter]);
rx, ry, rz = getextent(clumps, :kpc, center=[:boxcenter]);
[Mera]: Get clump data: 2020-02-08T20:42:14.641
domain:
xmin::xmax: 0.0 :: 1.0 ==> 0.0 [kpc] :: 48.0 [kpc]
ymin::ymax: 0.0 :: 1.0 ==> 0.0 [kpc] :: 48.0 [kpc]
zmin::zmax: 0.0 :: 1.0 ==> 0.0 [kpc] :: 48.0 [kpc]
Read 12 colums:
Symbol[:index, :lev, :parent, :ncell, :peak_x, :peak_y, :peak_z, Symbol("rho-"), Symbol("rho+"), :rho_av, :mass_cl, :relevance]
Memory used for data table :61.77734375 KB
-------------------------------------------------------The red lines show the shell that we want to cut-out as a sub-region from the full data:
figure(figsize=(15.5, 3.5))
theta = range(-pi, stop=pi, length=100)

subplot(1,3,1)
scatter(x,y)
plot( 10. .* sin.(theta) , 10 .* cos.(theta), color="red")
plot( 5. .* sin.(theta) , 5. .* cos.(theta), color="red", ls="--")
xlim(rx)
ylim(ry)
xlabel("x k[pc]")
ylabel("y [kpc]")


subplot(1,3,2)
scatter(x,z)
plot( 10. .* sin.(theta) , 10 .* cos.(theta), color="red")
plot( 5. .* sin.(theta) , 5. .* cos.(theta), color="red", ls="--")
xlim(rx)
ylim(rz)
xlabel("x [kpc]")
ylabel("z [kpc]")


subplot(1,3,3)
scatter(y,z)
plot( 10. .* sin.(theta) , 10 .* cos.(theta), color="red")
plot( 5. .* sin.(theta) , 5. .* cos.(theta), color="red", ls="--")
xlim(ry)
ylim(rz)
xlabel("y [kpc]")
ylabel("z [kpc]");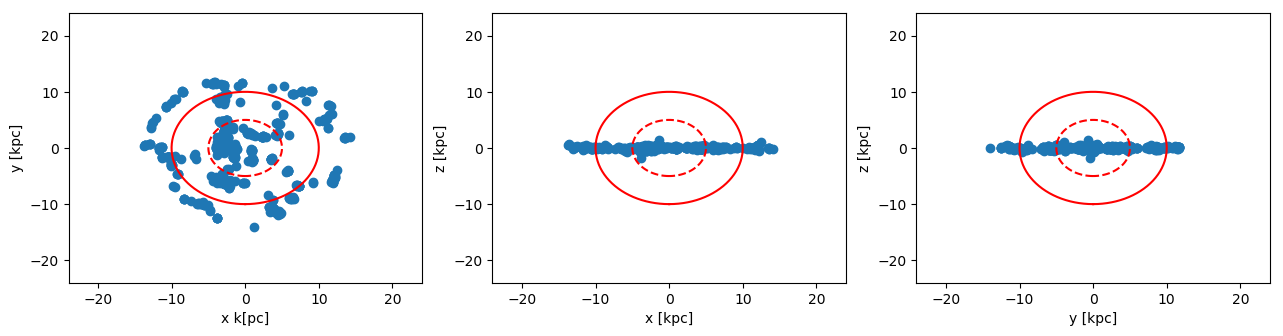
Spherical Shell:
Select the inner and outer radius of the spherical shell in unit "kpc", relative to the box center [24., 24., 24.]:
clumps_subregion = shellregion( clumps, :sphere,
                                radius=[5.,10.],
                                range_unit=:kpc,
                                center=[:boxcenter]);
[Mera]: 2020-02-08T20:42:19.499
center: [0.5, 0.5, 0.5] ==> [24.0 [kpc] :: 24.0 [kpc] :: 24.0 [kpc]]
domain:
xmin::xmax: 0.2916667 :: 0.7083333 ==> 14.0 [kpc] :: 34.0 [kpc]
ymin::ymax: 0.2916667 :: 0.7083333 ==> 14.0 [kpc] :: 34.0 [kpc]
zmin::zmax: 0.2916667 :: 0.7083333 ==> 14.0 [kpc] :: 34.0 [kpc]
Inner radius: 5.0 [kpc]
Outer radius: 10.0 [kpc]
Radius diff: 5.0 [kpc]
Memory used for data table :18.55859375 KB
-------------------------------------------------------x, y, z = getpositions(clumps_subregion, :kpc, center=[:boxcenter]); # shellregion
rx, ry, rz = getextent(clumps, :kpc, center=[:boxcenter]); # full boxfigure(figsize=(15.5, 3.5))
theta = range(-pi, stop=pi, length=100)
subplot(1,3,1)
scatter(x,y)
plot( 10. .* sin.(theta) , 10 .* cos.(theta), color="red")
plot( 5. .* sin.(theta) , 5. .* cos.(theta), color="red", ls="--")
xlim(rx)
ylim(ry)
xlabel("x k[pc]")
ylabel("y [kpc]")
subplot(1,3,2)
scatter(x,z)
plot( 10. .* sin.(theta) , 10 .* cos.(theta), color="red")
plot( 5. .* sin.(theta) , 5. .* cos.(theta), color="red", ls="--")
xlim(rx)
ylim(rz)
xlabel("x [kpc]")
ylabel("z [kpc]")
subplot(1,3,3)
scatter(y,z)
plot( 10. .* sin.(theta) , 10 .* cos.(theta), color="red")
plot( 5. .* sin.(theta) , 5. .* cos.(theta), color="red", ls="--")
xlim(ry)
ylim(rz)
xlabel("y [kpc]")
ylabel("z [kpc]");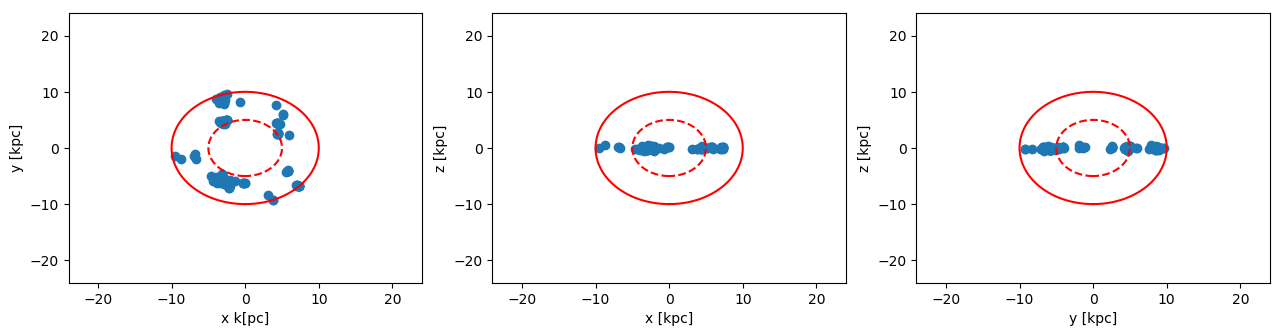
Spherical Shell: Get the data outside of the selected shell-region (inverse selection):
clumps_subregion = shellregion( clumps, :sphere,
                                radius=[5.,10.],
                                range_unit=:kpc,
                                center=[:boxcenter],
                                inverse=true);
[Mera]: 2020-02-08T20:42:23.949
center: [0.5, 0.5, 0.5] ==> [24.0 [kpc] :: 24.0 [kpc] :: 24.0 [kpc]]
domain:
xmin::xmax: 0.2916667 :: 0.7083333 ==> 14.0 [kpc] :: 34.0 [kpc]
ymin::ymax: 0.2916667 :: 0.7083333 ==> 14.0 [kpc] :: 34.0 [kpc]
zmin::zmax: 0.2916667 :: 0.7083333 ==> 14.0 [kpc] :: 34.0 [kpc]
Inner radius: 5.0 [kpc]
Outer radius: 10.0 [kpc]
Radius diff: 5.0 [kpc]
Memory used for data table :44.62109375 KB
-------------------------------------------------------x, y, z = getpositions(clumps_subregion, :kpc, center=[:boxcenter]); # shellregion
rx, ry, rz = getextent(clumps, :kpc, center=[:boxcenter] ); # full boxfigure(figsize=(15.5, 3.5))
theta = range(-pi, stop=pi, length=100)
subplot(1,3,1)
scatter(x,y)
plot( 10. .* sin.(theta) , 10 .* cos.(theta), color="red")
plot( 5. .* sin.(theta) , 5. .* cos.(theta), color="red", ls="--")
xlim(rx)
ylim(ry)
xlabel("x k[pc]")
ylabel("y [kpc]")
subplot(1,3,2)
scatter(x,z)
plot( 10. .* sin.(theta) , 10 .* cos.(theta), color="red")
plot( 5. .* sin.(theta) , 5. .* cos.(theta), color="red", ls="--")
xlim(rx)
ylim(rz)
xlabel("x [kpc]")
ylabel("z [kpc]")
subplot(1,3,3)
scatter(y,z)
plot( 10. .* sin.(theta) , 10 .* cos.(theta), color="red")
plot( 5. .* sin.(theta) , 5. .* cos.(theta), color="red", ls="--")
xlim(ry)
ylim(rz)
xlabel("y [kpc]")
ylabel("z [kpc]");